目錄
- 1. 下載grafana并安裝
- 2. 開啟grafana服務
- 3. 瀏覽器訪問并配置
1. 下載grafana并安裝
1.1 官網下載較慢����,在清華鏡像站下載
下載鏈接>> https://mirrors.tuna.tsinghua.edu.cn/grafana/yum/rpm/
1.2 下載之后上傳
上傳之后查看
[root@localhost ~]# ls
grafana-7.3.3-1.x86_64.rpm
1.3 yum安裝解決依賴關系
yum -y install grafana-7.3.3-1.x86_64.rpm
2. 開啟grafana服務
2.1 開啟服務
systemctl start grafana-server
2.2 查看端口驗證(grafana默認監聽3000端口)
[root@localhost ~]# netstat -nlpt|grep 3000
tcp6  0  0 :::3000     :::*     LISTEN  21185/grafana-serve
3. 瀏覽器訪問并配置
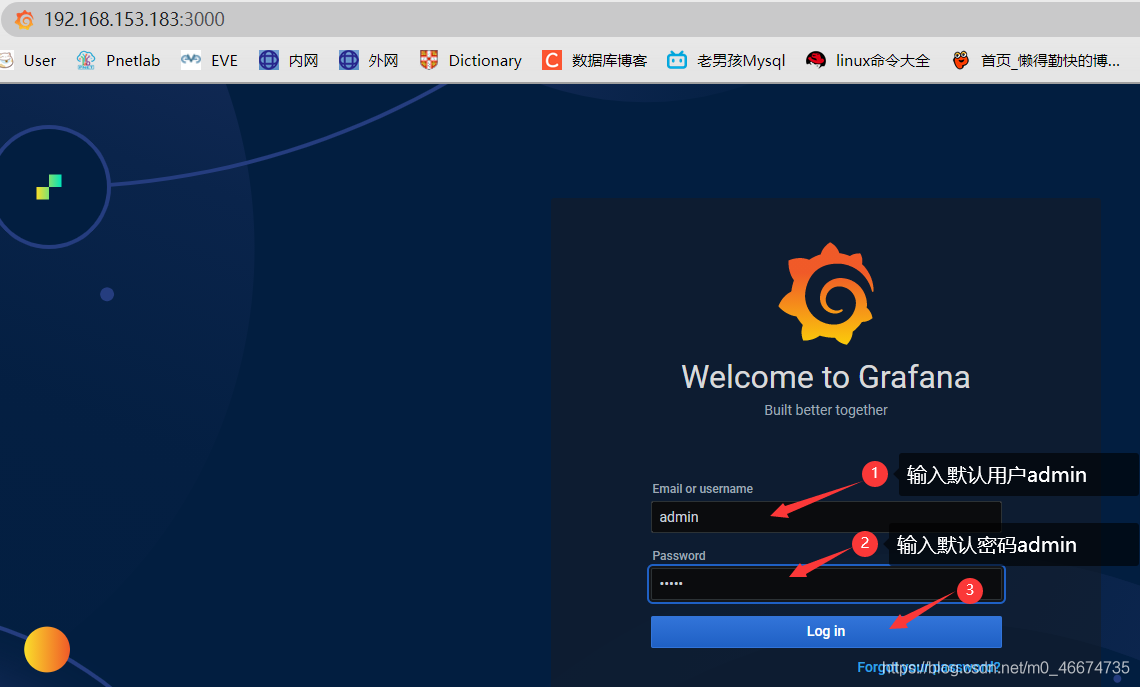
3.1 打開瀏覽器輸入 IP:3000 訪問
例如: 192.168.153.183:3000
3.2 訪問成功之后輸入默認的用戶名和密碼登錄
默認的用戶名和密碼均為:admin
3.3 登陸成功之后配置新的密碼

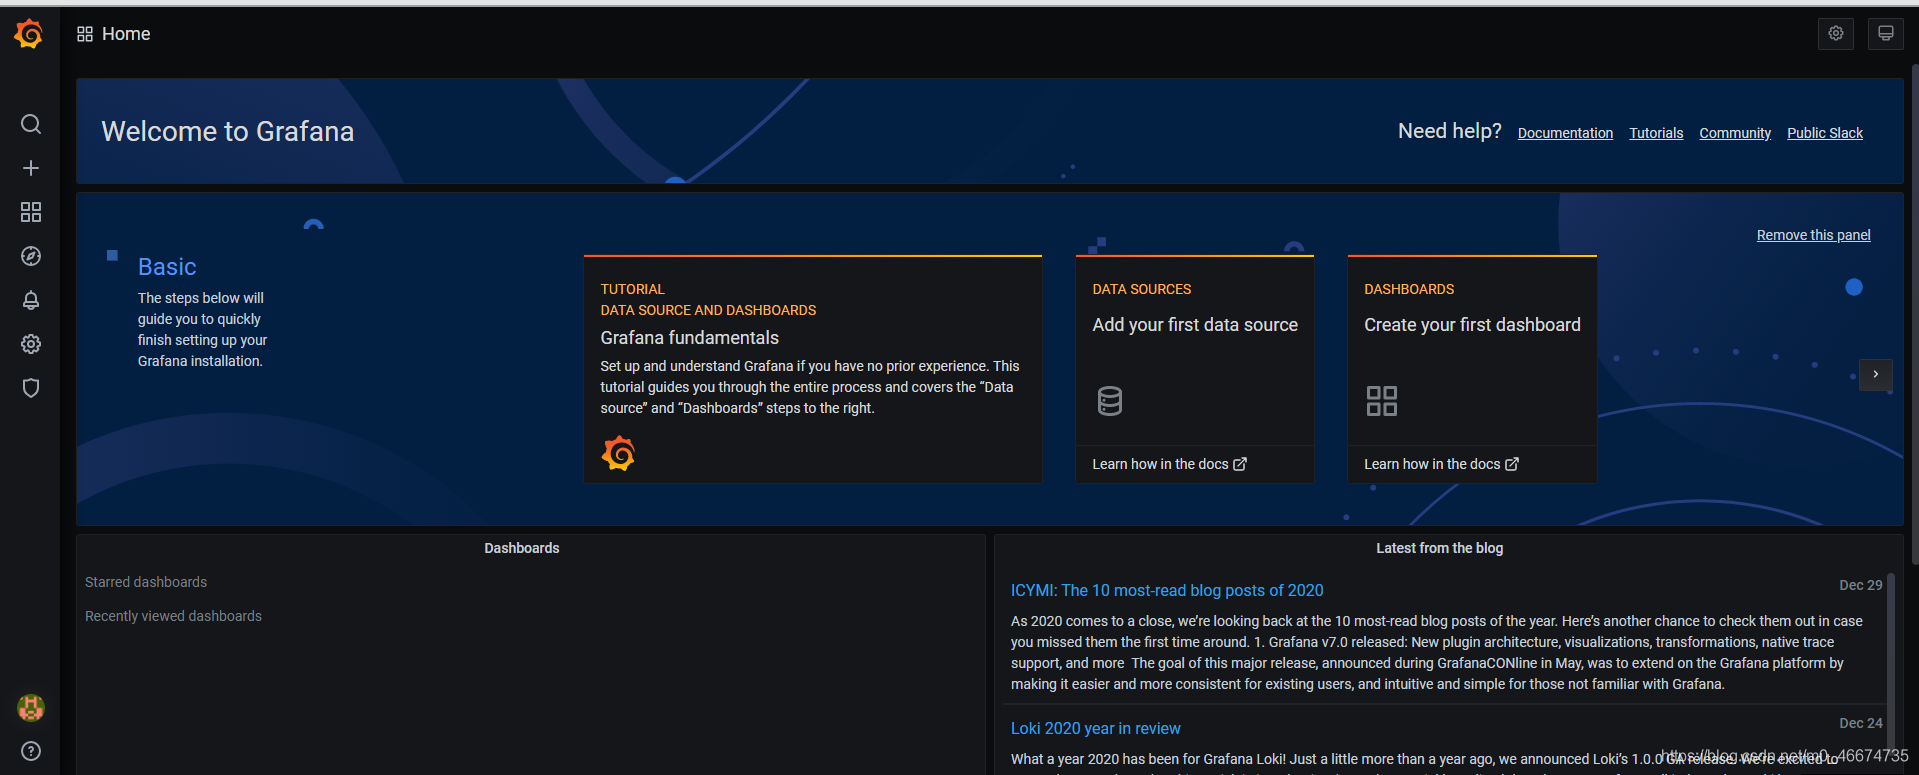
3.4 成功訪問grafana主頁
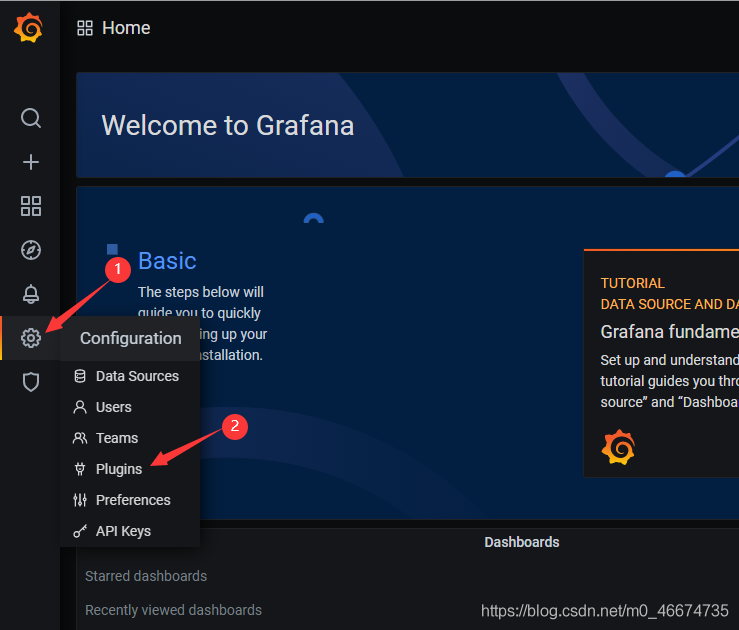
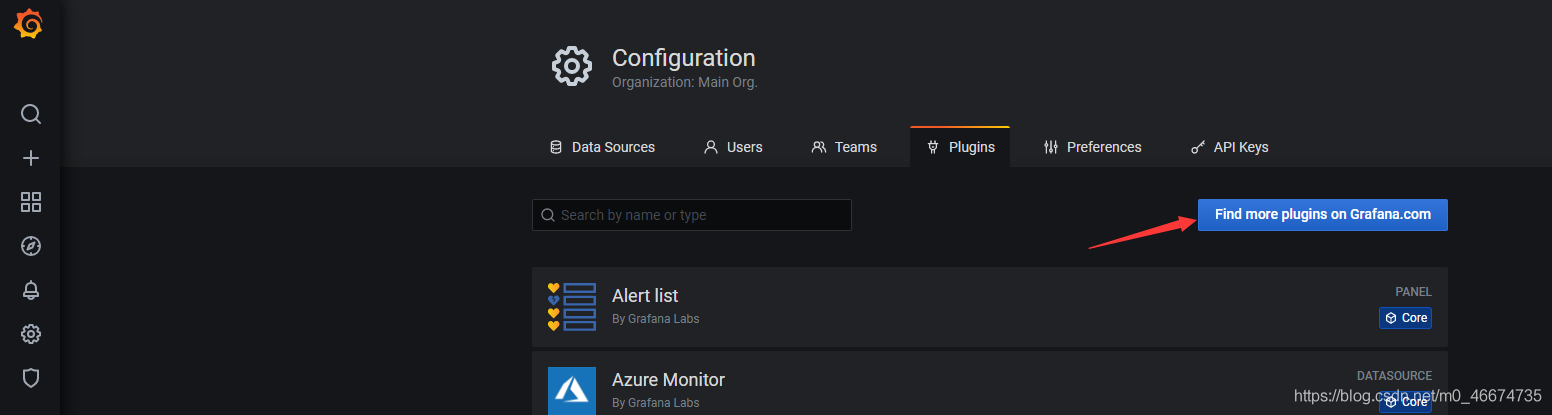
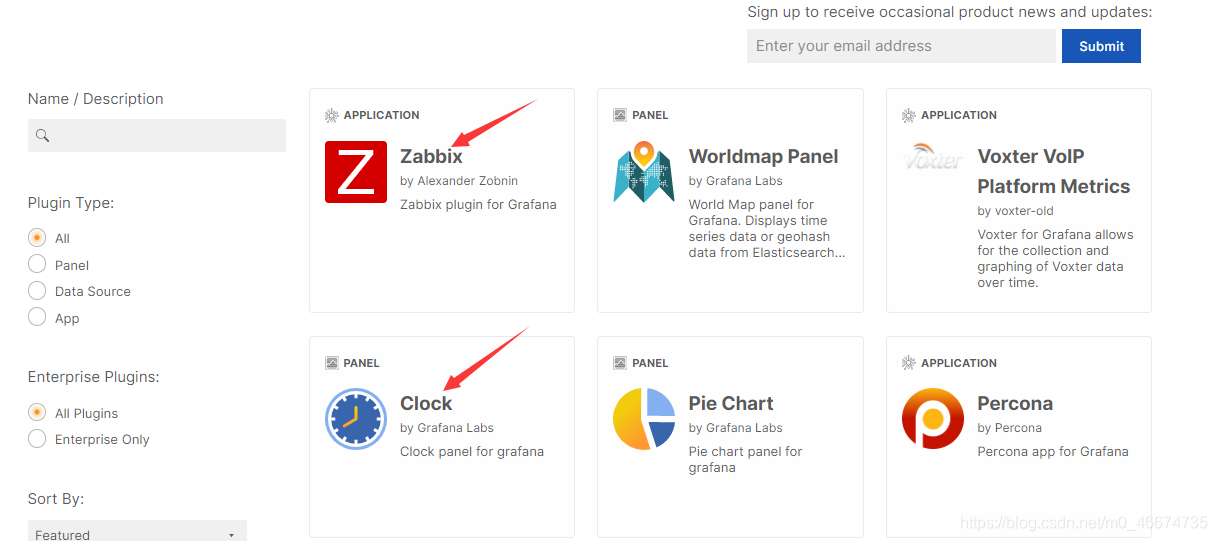
3.5 添加zabbix插件和clock插件
grafana 默認插件的存放位置為:/var/lib/grafana/plugins
1)
2)
3)
4)
5)
6)在服務器安裝
[root@localhost ~]# cd /var/lib/grafana/plugins/
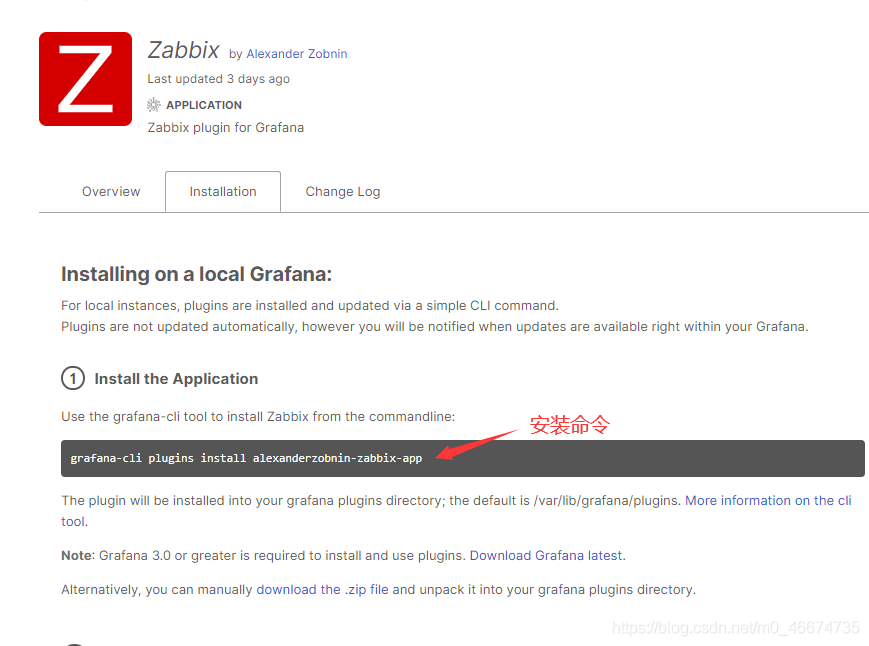
安裝zabbix創建
[root@localhost plugins]# grafana-cli plugins install alexanderzobnin-zabbix-app
installing alexanderzobnin-zabbix-app @ 4.1.1
from: https://grafana.com/api/plugins/alexanderzobnin-zabbix-app/versions/4.1.1/download
into: /var/lib/grafana/plugins
✔ Installed alexanderzobnin-zabbix-app successfully
Restart grafana after installing plugins . service grafana-server restart>
[root@localhost plugins]#
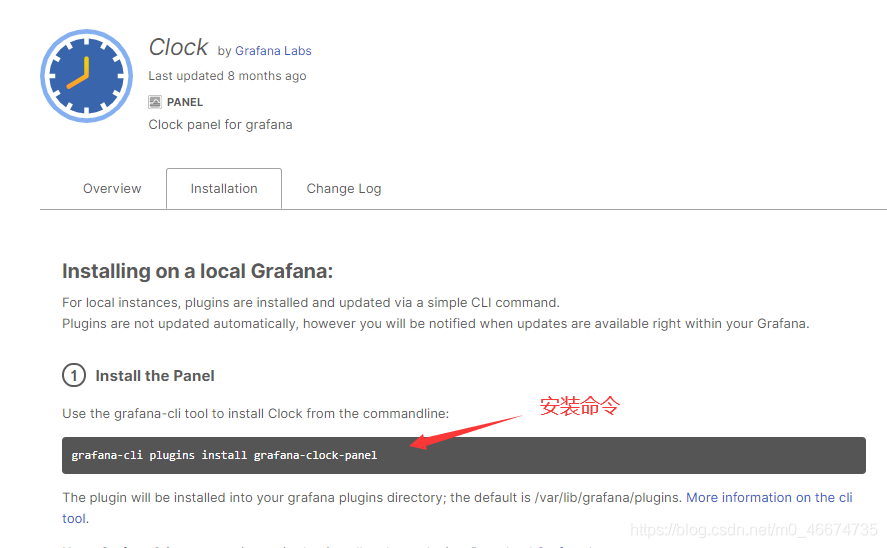
安裝clock插件
[root@localhost plugins]# grafana-cli plugins install grafana-clock-panel
installing grafana-clock-panel @ 1.1.1
from: https://grafana.com/api/plugins/grafana-clock-panel/versions/1.1.1/download
into: /var/lib/grafana/plugins
✔ Installed grafana-clock-panel successfully
Restart grafana after installing plugins . service grafana-server restart>
[root@localhost plugins]#
安裝之后查看
[root@localhost plugins]# ls
alexanderzobnin-zabbix-app grafana-clock-panel
6)重啟grafana服務
systemctl restart grafana-server
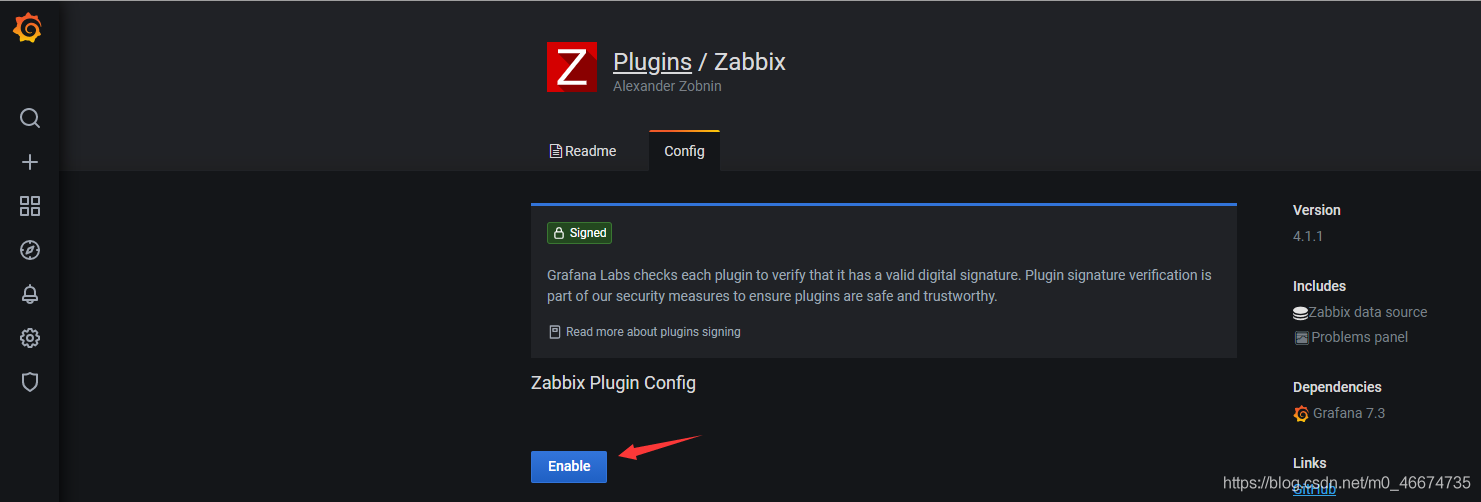
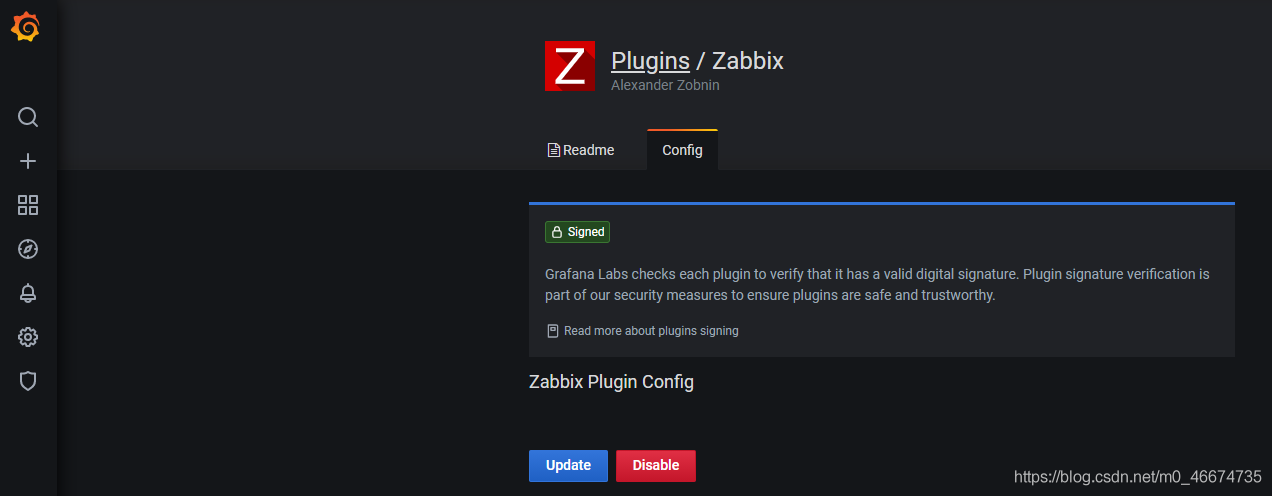
7)
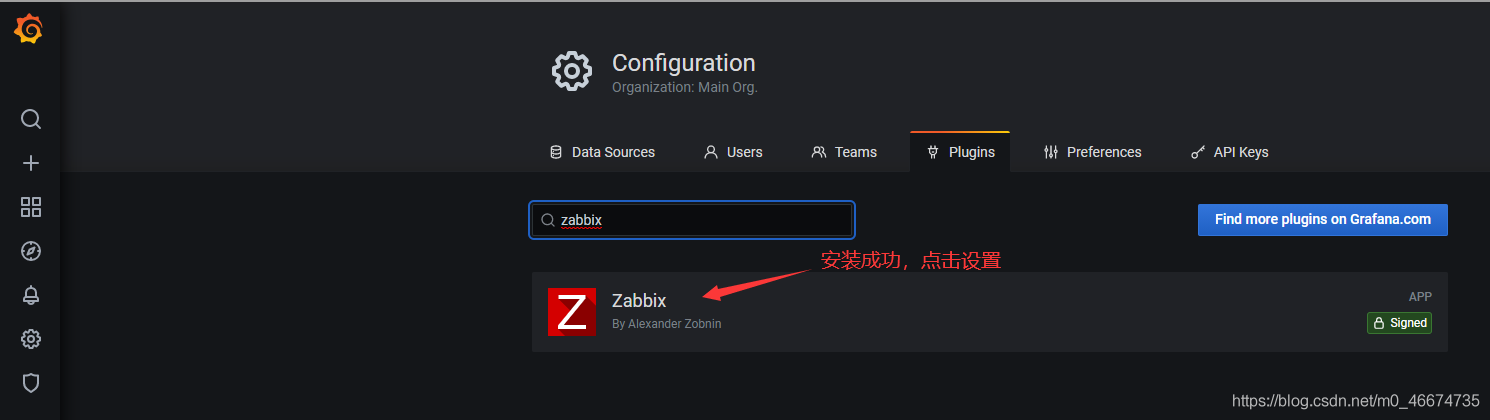
8)使能 zabbix(clock插件安裝之后直接可以使用����,無需設置)
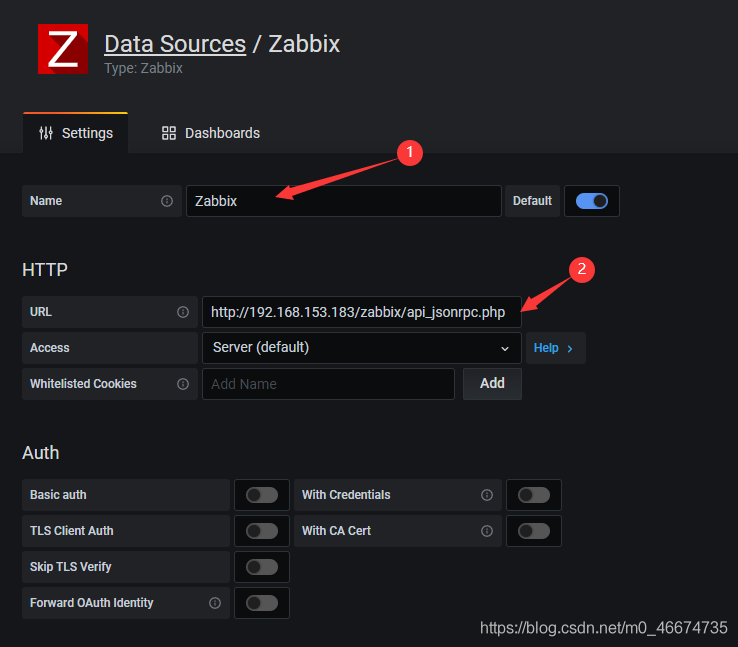
3.6 添加zabbix數據源
1)
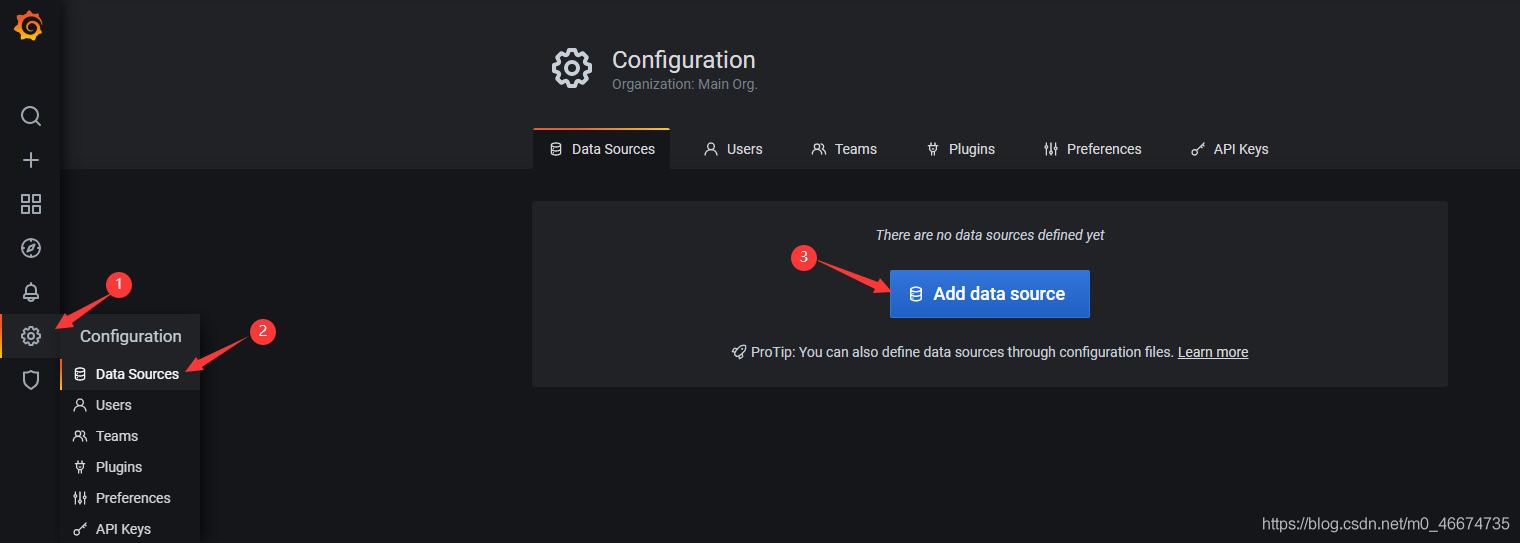
2)
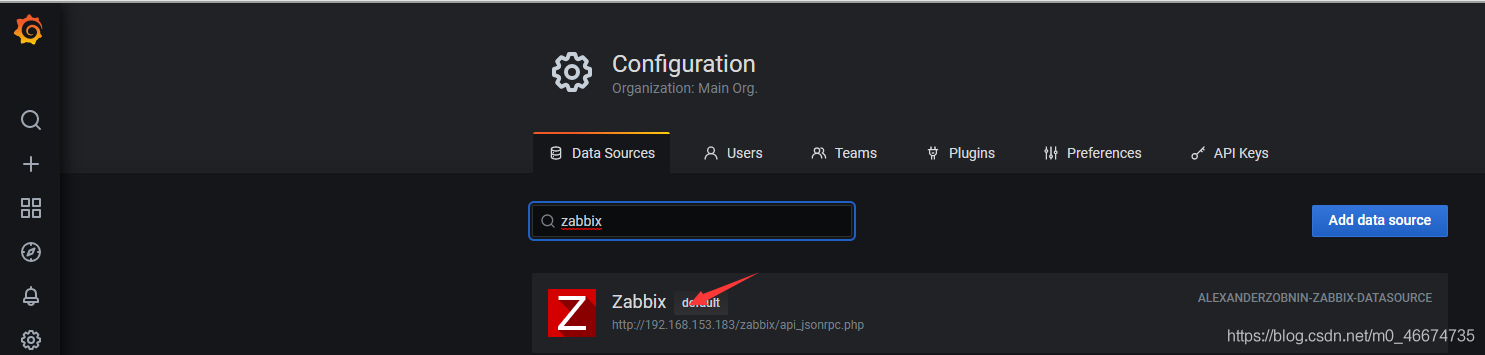
3)
4)輸入連接zabbix接口的用戶名和密碼����,用戶名為admin,密碼為 zabbix
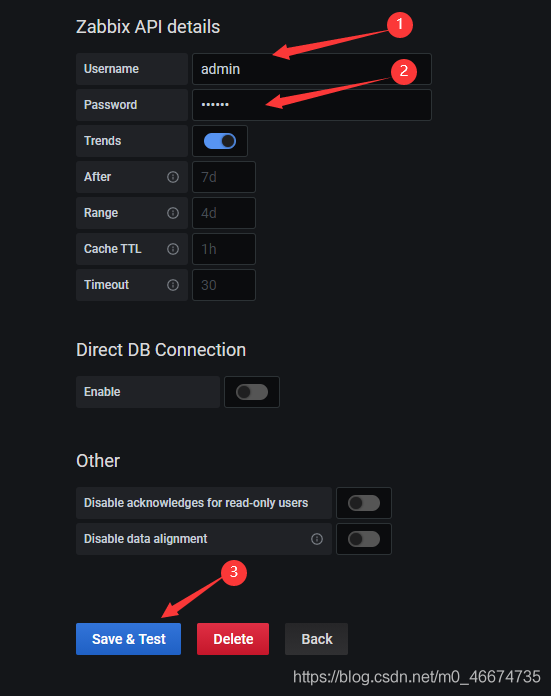
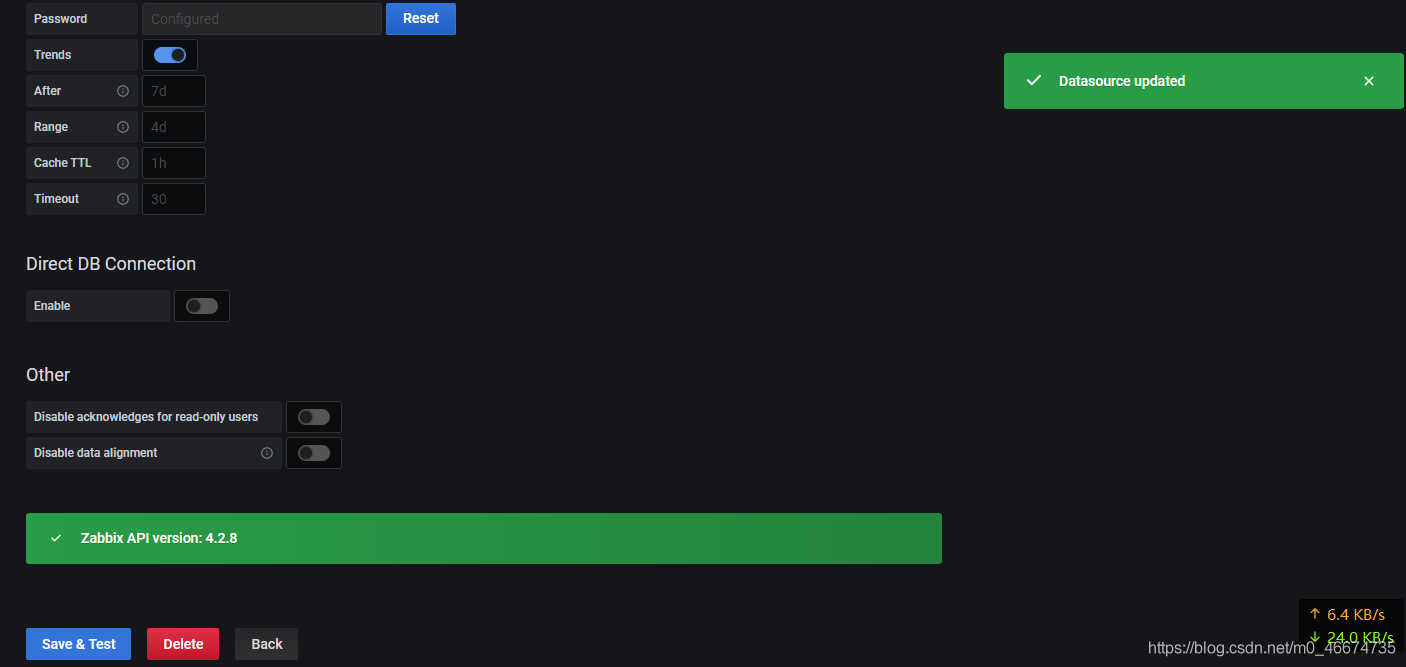
5)測試成功
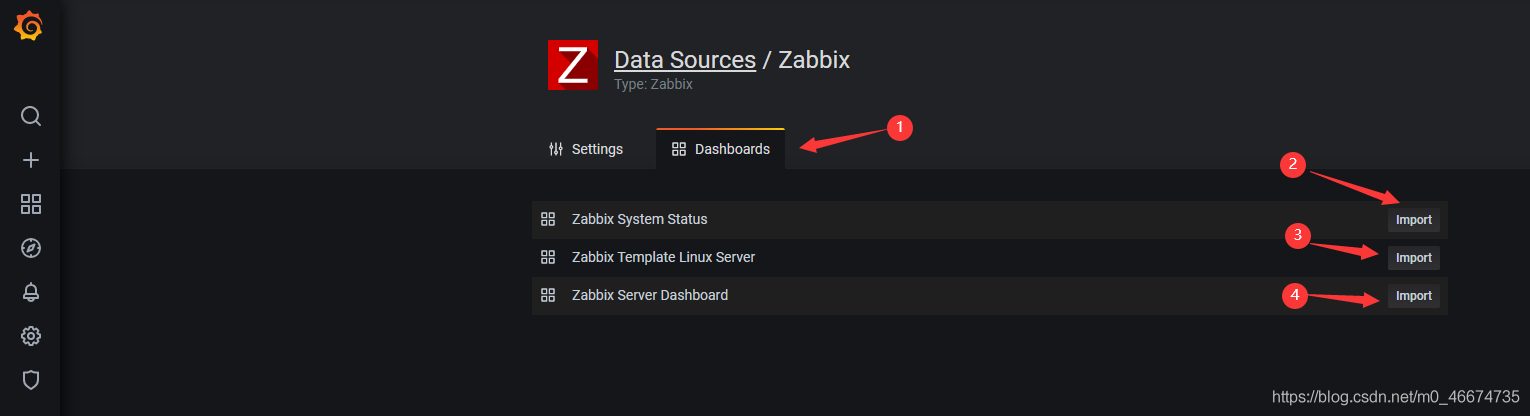
6)導入儀表板
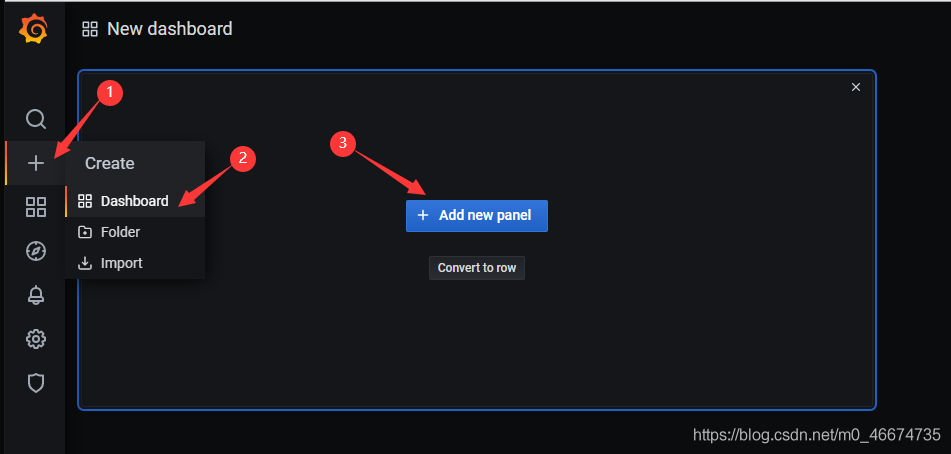
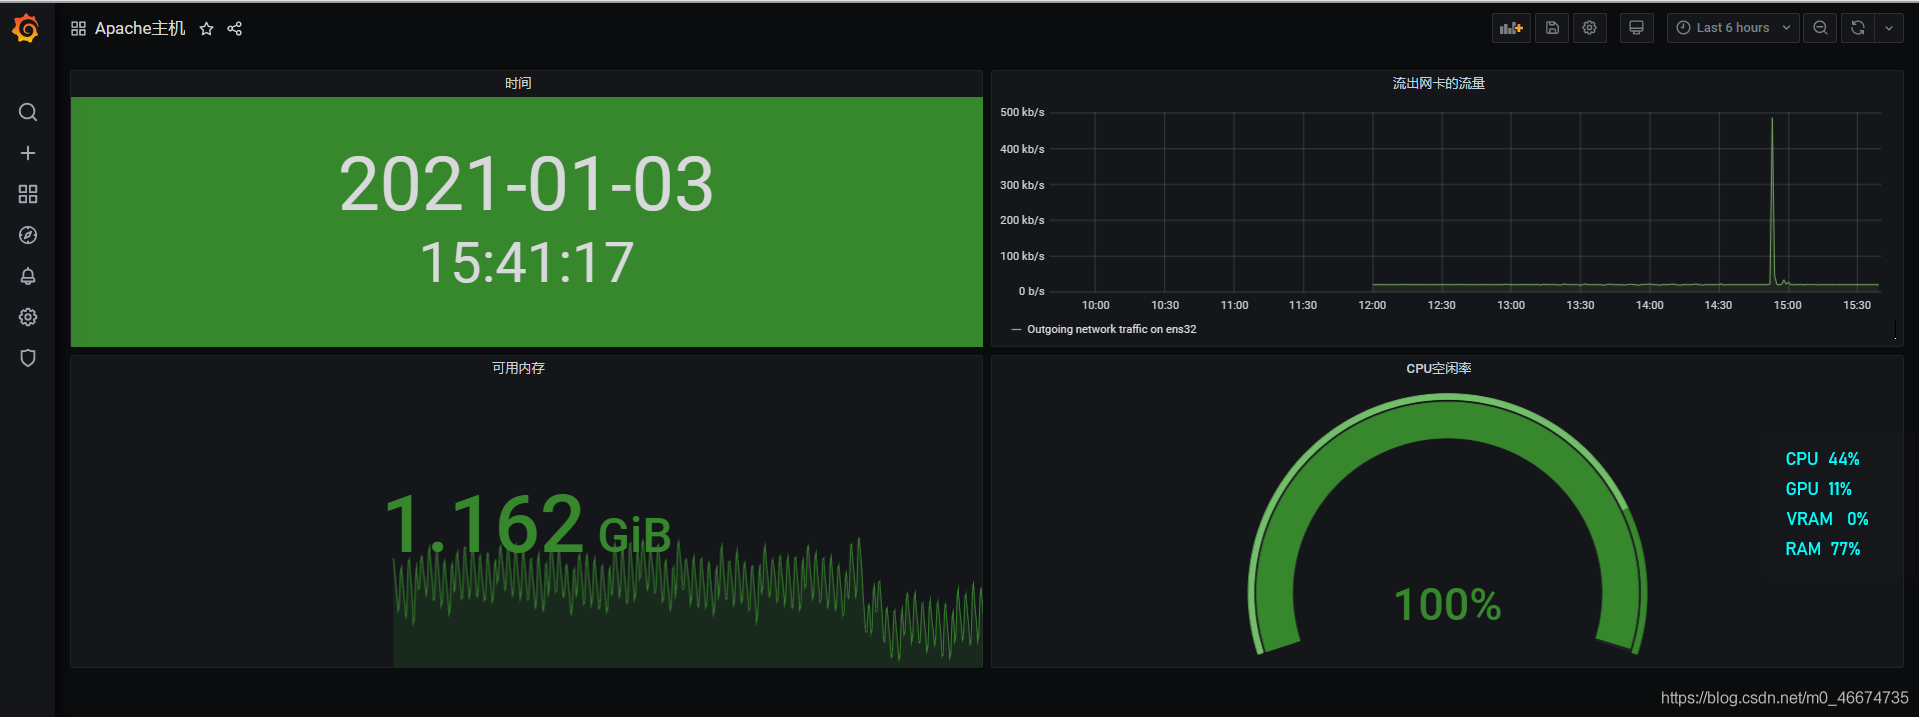
3.7 創建新的儀表板
3.8 創建CPU空閑率儀表板
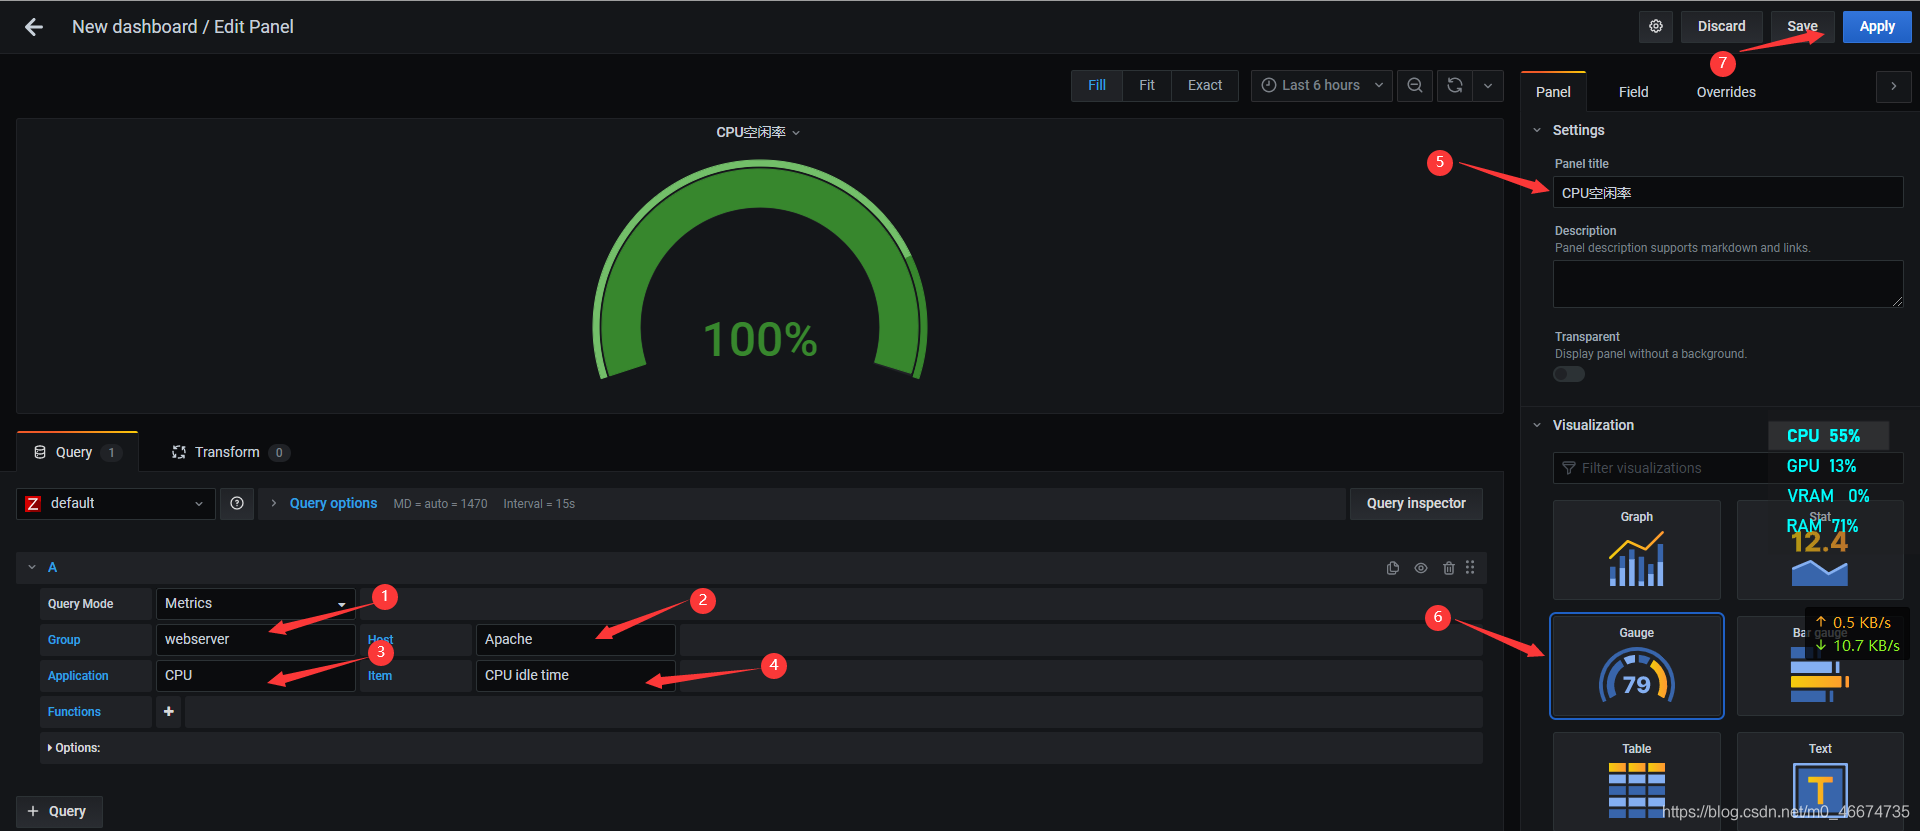
3.9 添加儀表板
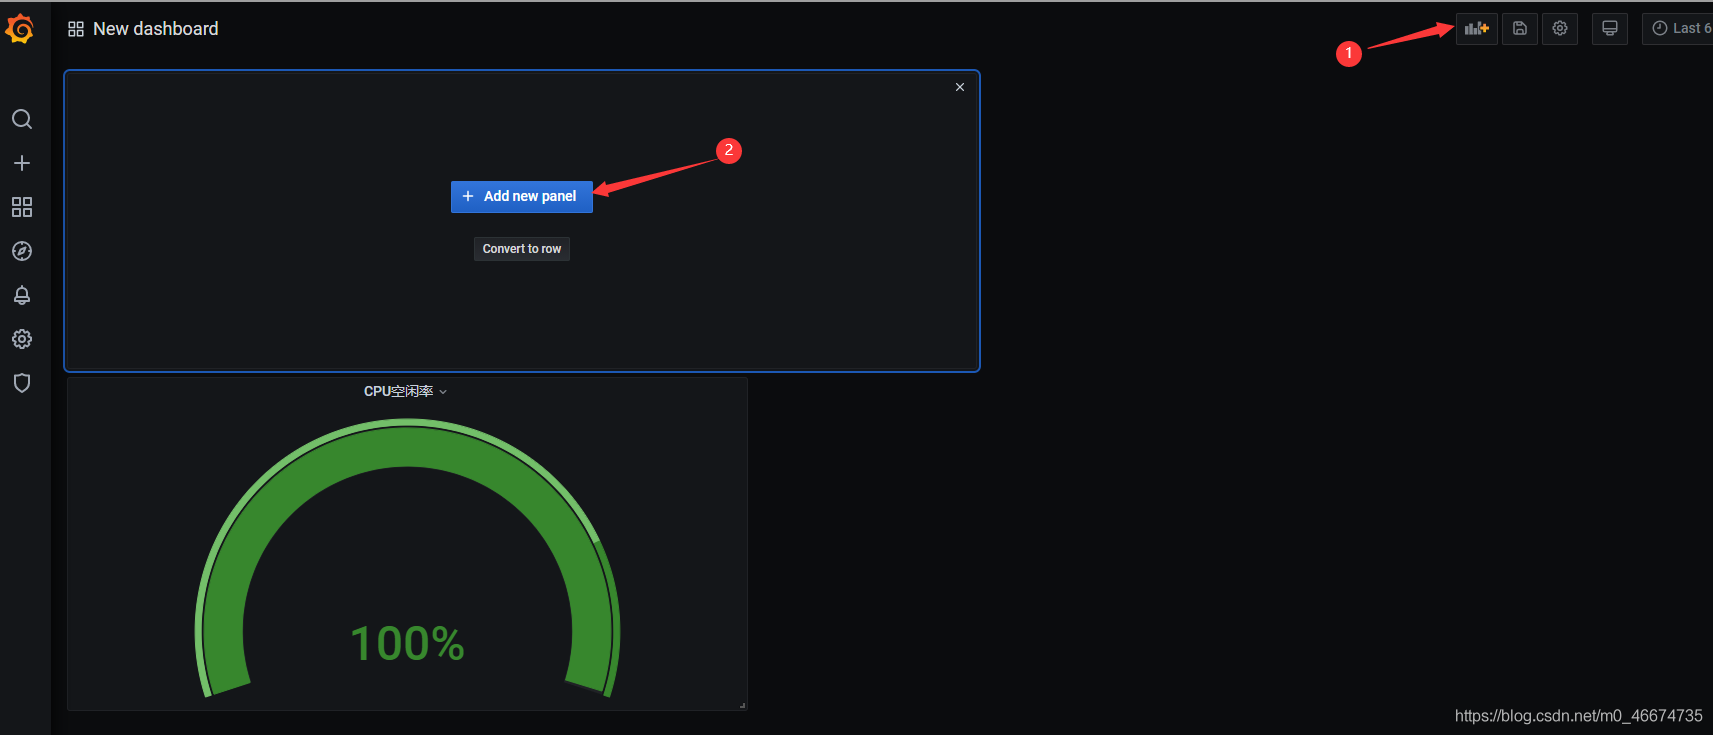
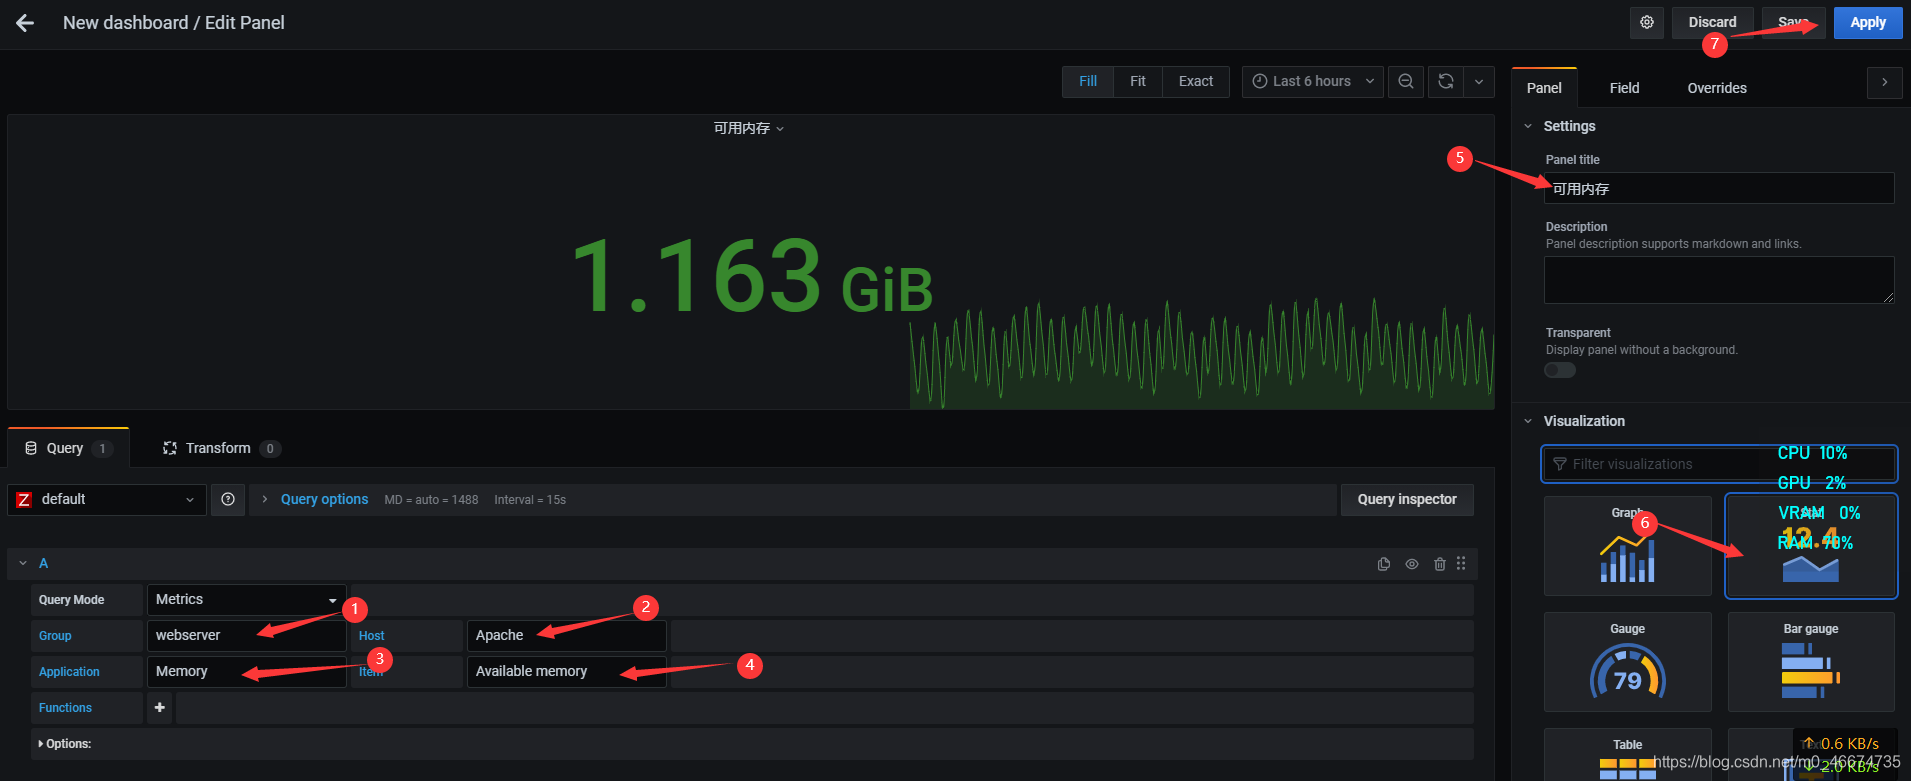
3.9 添加可用內存儀表板
3.10 添加時間儀表板
1)
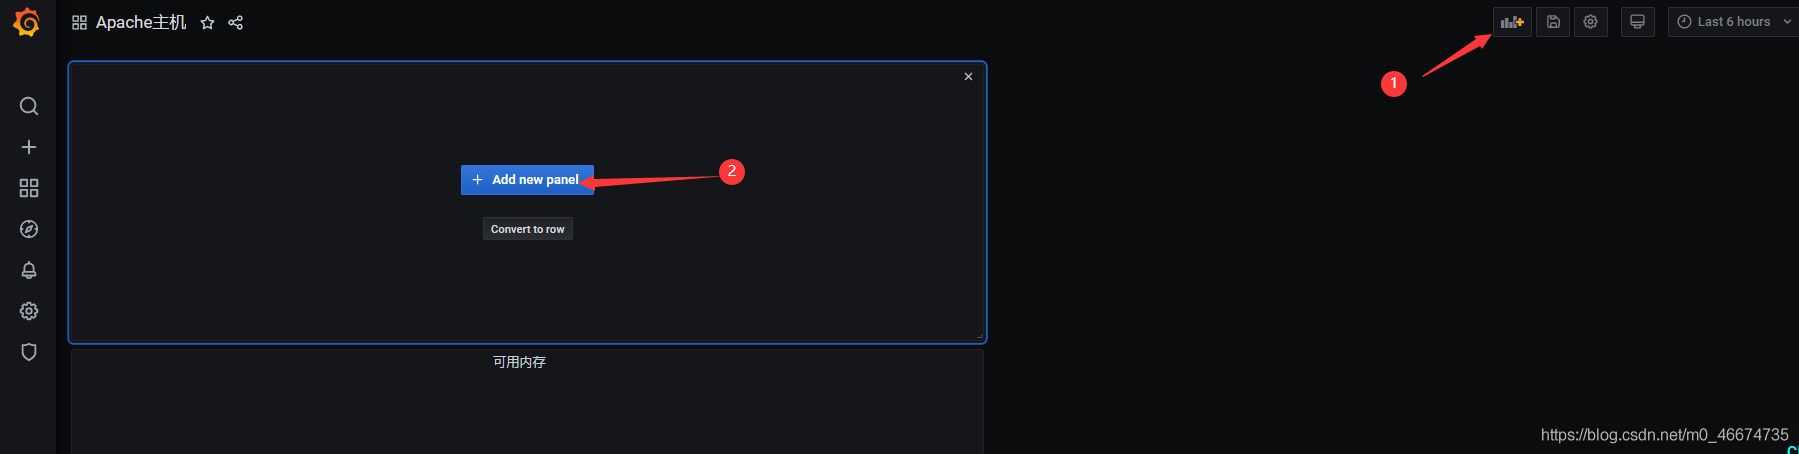
2)

3)
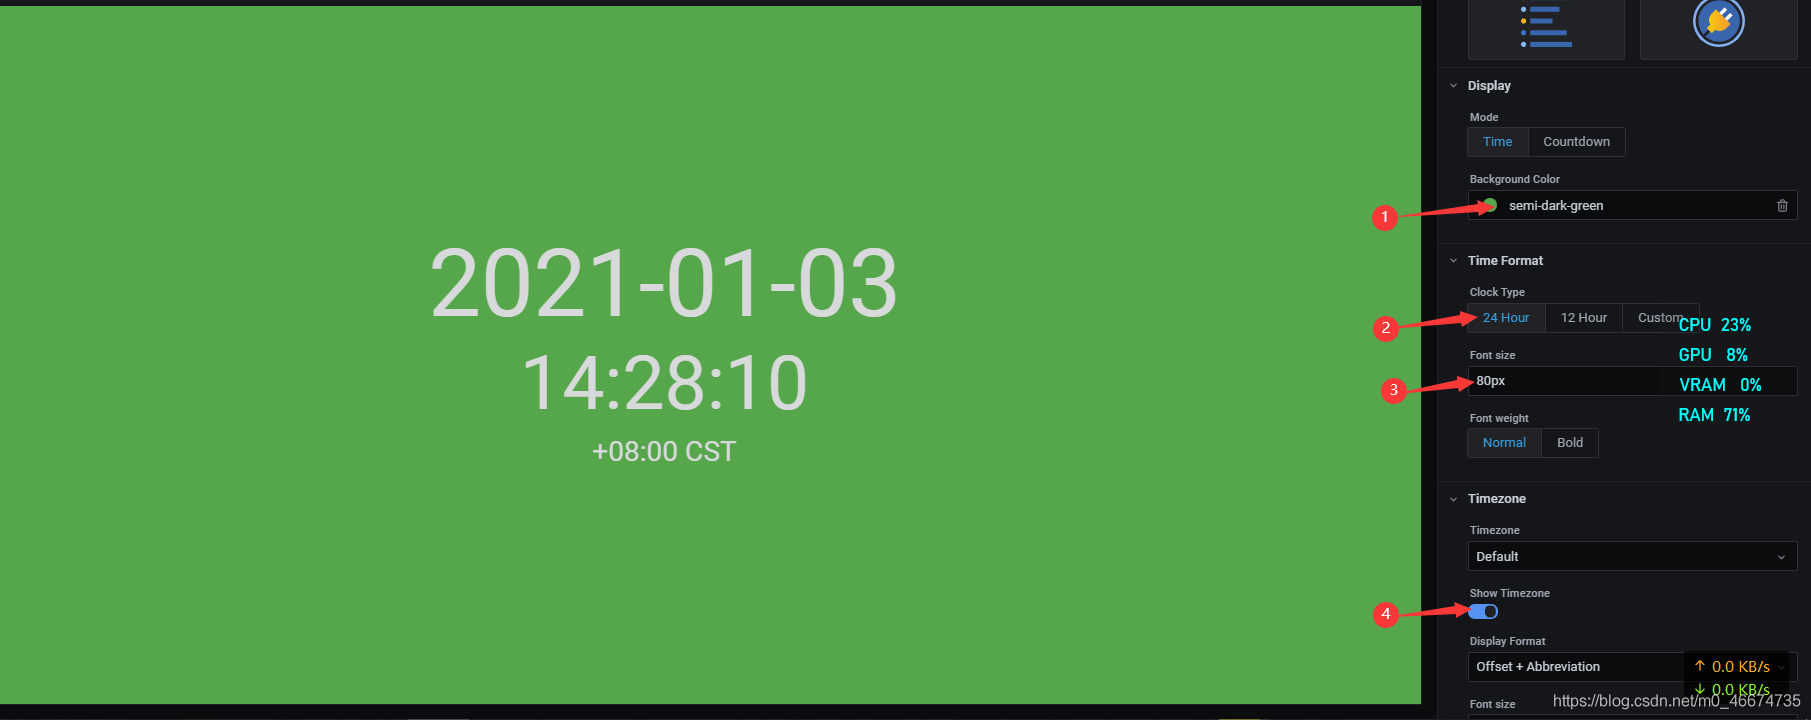
4)
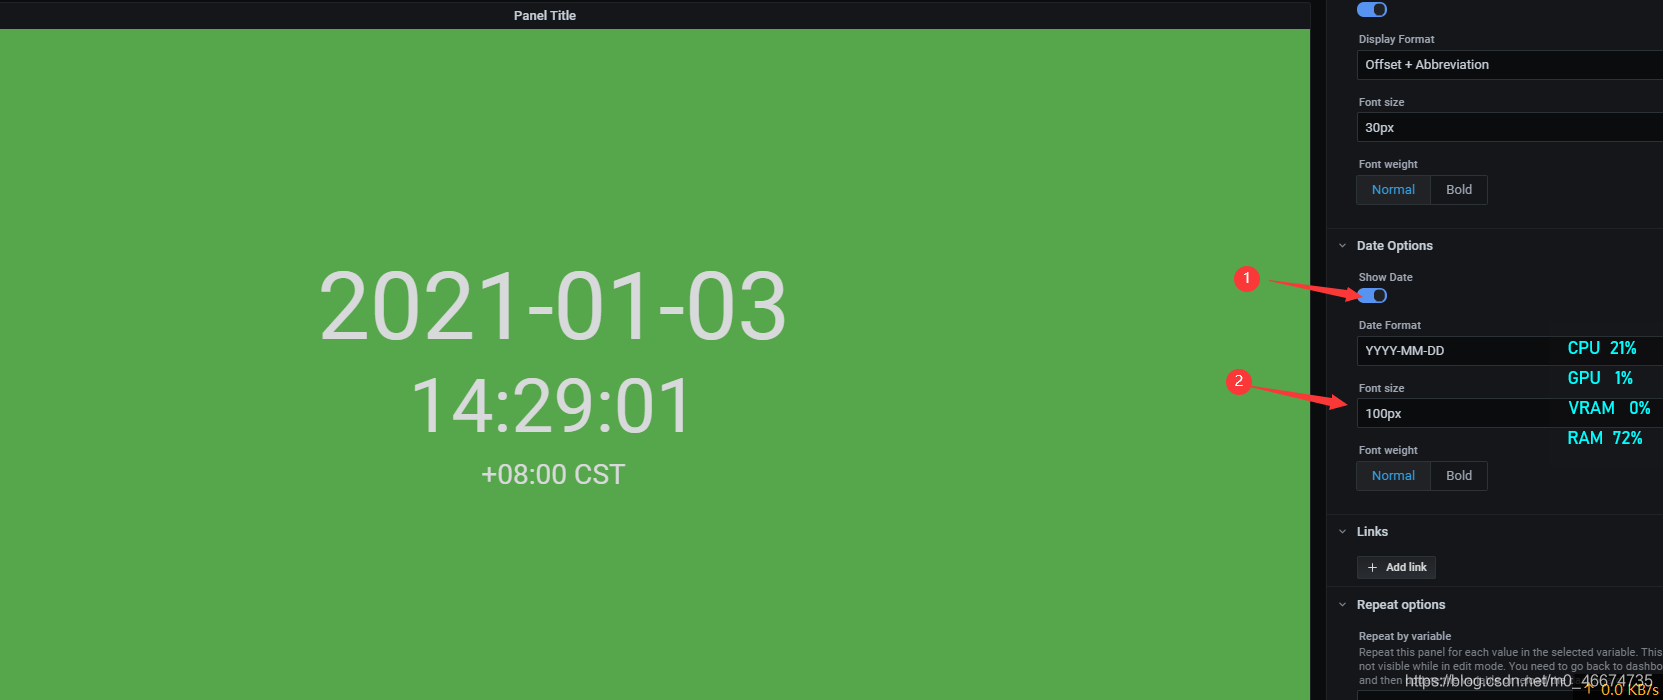
5)
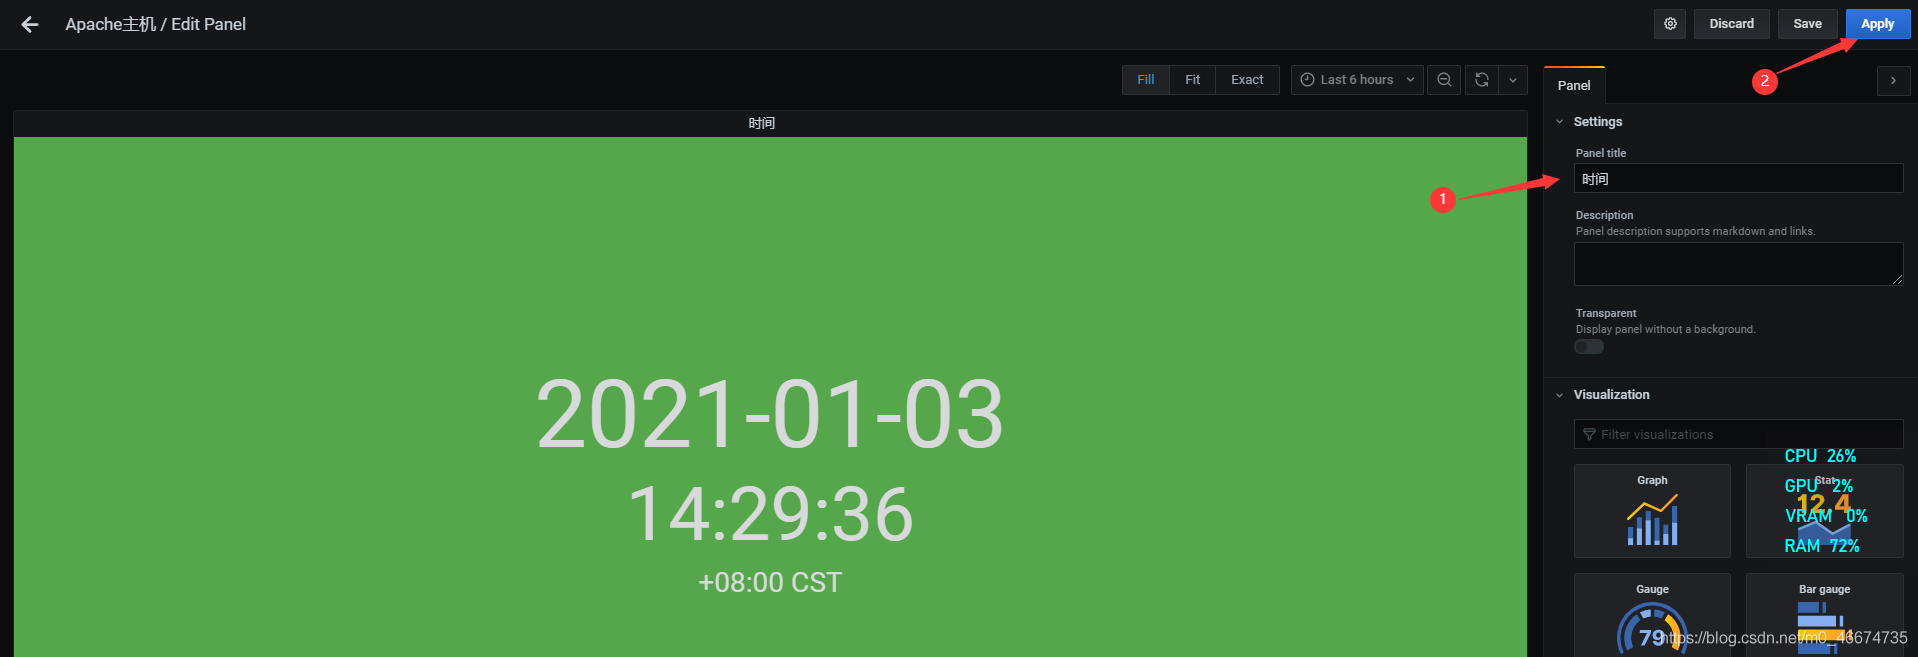
6)
到此這篇關于grafana安裝及使用的文章就介紹到這了,更多相關grafana安裝及使用內容請搜索腳本之家以前的文章或繼續瀏覽下面的相關文章希望大家以后多多支持腳本之家����!
您可能感興趣的文章:- Linux下安裝grafana并且添加influxdb監控的方法
- 使用Prometheus+Grafana的方法監控Springboot應用教程詳解
- 使用Grafana+Prometheus監控mysql服務性能
- 使用Grafana 展示Docker容器的監控圖表并設置郵件報警規則(圖解)
- 在Ubuntu上使用Grafana監控Docker的方法