在matplotlib中常用的標題主要三種:窗口標題、圖像標題和子圖標題。
先通過三個案例簡要說明這三類標題的實現(xiàn)。
窗口標題、圖像標題,子圖標題(僅1個子圖)
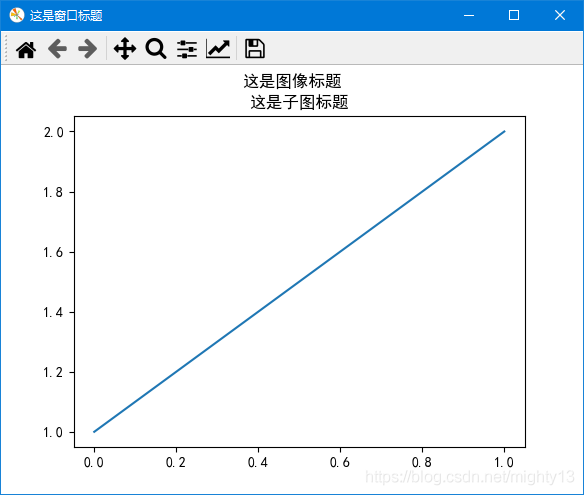
import matplotlib.pyplot as plt

plt.rcParams['font.sans-serif'] = 'SimHei'

fig = plt.figure()
plt.plot([1, 2])
# 設(shè)置圖像標題
plt.suptitle("這是圖像標題")
# 設(shè)置子圖標題
plt.title("這是子圖標題")
# 獲取默認窗口標題
current_title = fig.canvas.manager.window.windowTitle()
print("默認窗口:",current_title)
# 設(shè)置窗口標題方式一
fig.canvas.set_window_title("這是窗口標題")
# 設(shè)置窗口標題方式二
fig.canvas.manager.window.setWindowTitle("這是窗口標題")

plt.show()
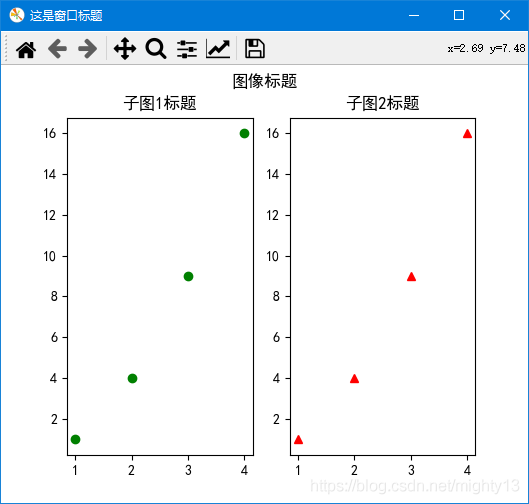
窗口標題、圖像標題、子圖標題(多子圖)
使用subplot函數(shù)實現(xiàn)子圖
import matplotlib.pyplot as plt

plt.rcParams['font.sans-serif'] = 'SimHei'

fig = plt.figure()
plt.subplot(1, 2, 1)
plt.plot([1,2,3,4], [1,4,9,16], "go")
# 設(shè)置子圖1標題
plt.title("子圖1標題")

plt.subplot(122)
plt.plot([1,2,3,4], [1,4,9,16], "r^") # r^ 表示 紅色(red)三角
# 設(shè)置子圖2標題
plt.title("子圖2標題")
# 設(shè)置圖像標題
plt.suptitle("圖像標題")
# 設(shè)置窗口標題
#fig.canvas.set_window_title("這是窗口標題")
fig.canvas.manager.window.setWindowTitle("這是窗口標題")

plt.show()
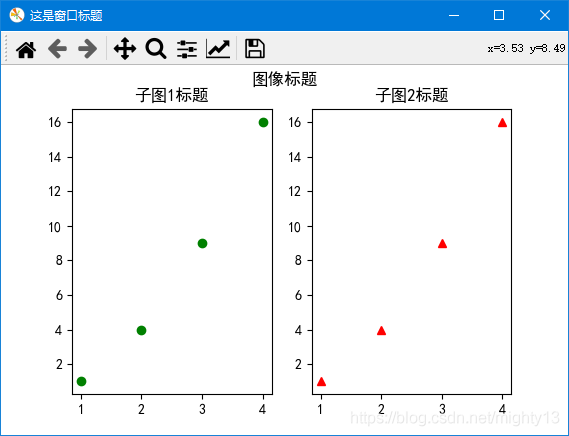
使用subplots函數(shù)subplots實現(xiàn)子圖
import matplotlib.pyplot as plt

plt.rcParams['font.sans-serif'] = 'SimHei'

fig, ax = plt.subplots(nrows=1, ncols=2, figsize=(6,6))
ax[0].plot([1,2,3,4], [1,4,9,16], "go")
# 設(shè)置子圖1標題
ax[0].set_title("子圖1標題")
ax[1].plot([1,2,3,4], [1,4,9,16], "r^")
# 設(shè)置子圖2標題
ax[1].set_title("子圖2標題")
# 設(shè)置圖像標題
plt.suptitle("圖像標題")
# 設(shè)置窗口標題
fig.canvas.manager.window.setWindowTitle("這是窗口標題")

plt.show()
原理分析
通過前面三個案例可知:
窗口標題
設(shè)置窗口標題可以用兩種方法:
一種是調(diào)用figure.canvas對象的set_window_title方法,一種是figure.canvas.manager.window對象的setWindowTitle方法。通過下面源碼可知,這兩種方法其實是等價的。
因此在日常實現(xiàn)過程中,關(guān)鍵是獲取當前圖像對象(figure),即案例中的fig。該方法只有一個參數(shù),類型為字符串。
可以通過
通過figure.canvas.manager.window對象的windowTitle方法可以獲取窗口標題。
class FigureManagerQT(FigureManagerBase):
  def set_window_title(self, title):
    self.window.setWindowTitle(title)
圖像標題
調(diào)用plt.suptitle函數(shù)即可。根據(jù)源碼可知,plt.suptitle函數(shù)其實是調(diào)用了當前figure對象的suptitle方法。
suptitle函數(shù)參數(shù)
  def suptitle(self, t, **kwargs):
    """
    Add a centered title to the figure.

    Parameters
    ----------
    t : str
      The title text.

    x : float, default 0.5
      The x location of the text in figure coordinates.

    y : float, default 0.98
      The y location of the text in figure coordinates.

    horizontalalignment, ha : {'center', 'left', right'}, default: 'center'
      The horizontal alignment of the text relative to (*x*, *y*).

    verticalalignment, va : {'top', 'center', 'bottom', 'baseline'}, \

default: 'top'
      The vertical alignment of the text relative to (*x*, *y*).

    fontsize, size : default: :rc:`figure.titlesize`
      The font size of the text. See `.Text.set_size` for possible
      values.

    fontweight, weight : default: :rc:`figure.titleweight`
      The font weight of the text. See `.Text.set_weight` for possible
      values.

    Returns
    -------
    text
      The `.Text` instance of the title.

    Other Parameters
    ----------------
    fontproperties : None or dict, optional
      A dict of font properties. If *fontproperties* is given the
      default values for font size and weight are taken from the
      `.FontProperties` defaults. :rc:`figure.titlesize` and
      :rc:`figure.titleweight` are ignored in this case.

    **kwargs
      Additional kwargs are `matplotlib.text.Text` properties.

    Examples
    --------
    >>> fig.suptitle('This is the figure title', fontsize=12)
    """
子圖標題
- 使用
subplot函數(shù):在所在子圖中,使用plt.title函數(shù)。
- 使用
subplots函數(shù):使用子圖對象調(diào)用set_title方法。
plt.title函數(shù)和axes.set_title方法的參數(shù)相同。
注意,在使用subplots函數(shù)創(chuàng)建子圖時,為什么不能使用plt.title函數(shù)設(shè)置子圖標題呢?
根據(jù)title函數(shù)的源碼可知,title函數(shù)其實是通過gca()函數(shù)獲取子圖,然后再調(diào)用set_title方法設(shè)置標題的。根據(jù)實驗,在使用subplots函數(shù)函數(shù)創(chuàng)建多個子圖時,plt.gca()只能得到最后一個子圖的標題,因此,在某些情況下使用plt.title函數(shù)可設(shè)置最后一個子圖的標題。
plt.title函數(shù)和axes.set_title方法源碼
def title(label, fontdict=None, loc=None, pad=None, *, y=None, **kwargs):
  return gca().set_title(
    label, fontdict=fontdict, loc=loc, pad=pad, y=y, **kwargs)
Axes.set_title(self, label, fontdict=None, loc=None, pad=None, *, y=None, **kwargs):
  """
  Set a title for the axes.

  Set one of the three available axes titles. The available titles
  are positioned above the axes in the center, flush with the left
  edge, and flush with the right edge.

  Parameters
  ----------
  label : str
    Text to use for the title

  fontdict : dict
    A dictionary controlling the appearance of the title text,
    the default *fontdict* is::

      {'fontsize': rcParams['axes.titlesize'],
      'fontweight': rcParams['axes.titleweight'],
      'color': rcParams['axes.titlecolor'],
      'verticalalignment': 'baseline',
      'horizontalalignment': loc}

  loc : {'center', 'left', 'right'}, default: :rc:`axes.titlelocation`
    Which title to set.

  y : float, default: :rc:`axes.titley`
    Vertical axes loation for the title (1.0 is the top). If
    None (the default), y is determined automatically to avoid
    decorators on the axes.

  pad : float, default: :rc:`axes.titlepad`
    The offset of the title from the top of the axes, in points.

  Returns
  -------
  `.Text`
    The matplotlib text instance representing the title

  Other Parameters
  ----------------
  **kwargs : `.Text` properties
    Other keyword arguments are text properties, see `.Text` for a list
    of valid text properties.
  """
plt.gca()實驗
import matplotlib.pyplot as plt

plt.rcParams['font.sans-serif'] = 'SimHei'

fig, ax = plt.subplots(nrows=1, ncols=2, figsize=(6,6))
ax[0].plot([1,2,3,4], [1,4,9,16], "go")
ax[1].plot([1,2,3,4], [1,4,9,16], "r^")

print(plt.gca())
print(ax[0],ax[1])
結(jié)果為
AxesSubplot(0.547727,0.11;0.352273x0.77)
AxesSubplot(0.125,0.11;0.352273x0.77) AxesSubplot(0.547727,0.11;0.352273x0.77)
到此這篇關(guān)于matplotlib源碼解析標題實現(xiàn)(窗口標題,標題,子圖標題不同之間的差異)的文章就介紹到這了,更多相關(guān)matplotlib 標題內(nèi)容請搜索腳本之家以前的文章或繼續(xù)瀏覽下面的相關(guān)文章希望大家以后多多支持腳本之家!
您可能感興趣的文章:- matplotlib subplots 設(shè)置總圖的標題方法
- Python使用matplotlib模塊繪制圖像并設(shè)置標題與坐標軸等信息示例
- Python使用Matplotlib模塊時坐標軸標題中文及各種特殊符號顯示方法